Free Website Speed Test – Check Core Web Vitals, Page Load Time & Get Fix Recommendations
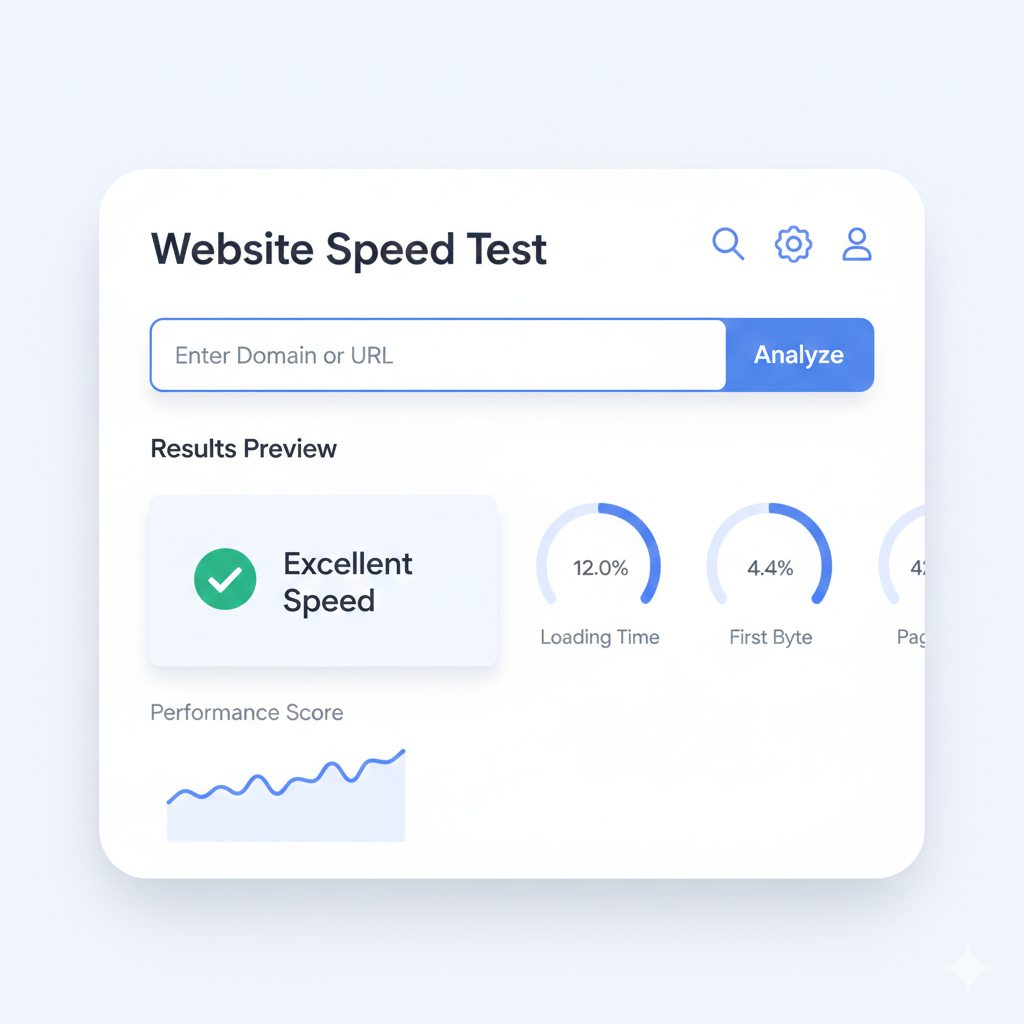
Instantly analyze any URL for LCP, CLS, INP, TTFB, FCP and overall performance score. Works for both desktop and mobile. Results in seconds.
Connecting to server…
Optimization Recommendations
How to Run a Free Website Speed Test (Step-by-Step)
Getting your page load speed, Core Web Vitals score, and actionable fix recommendations takes under 30 seconds. Here's exactly what to do:
Choose Device Type
Select Desktop or Mobile at the top of the tool. Google uses mobile-first indexing, so always test both.
Enter Your Full URL
Paste the complete URL including https:// — e.g., https://yourwebsite.com/blog/post. Test specific pages, not just your homepage.
Click "Test Speed"
Our tool analyzes your page's load time, TTFB, LCP, FCP, CLS, and INP in real time. This takes 10–20 seconds.
Review Your Score
See your overall performance score (0–100), individual metric grades, and a prioritized list of fixes ranked by impact.
Why Website Speed Directly Affects Your Google Rankings and Revenue
A slow website is not just a user experience problem — it is an SEO ranking problem and a business revenue problem. According to Google's research, 53% of mobile visitors abandon a page that takes longer than 3 seconds to load. For every additional second of load time, conversions drop by an average of 7%.
Since the Google Page Experience Update in 2021, Core Web Vitals (LCP, CLS, and INP) became official ranking signals. Pages that pass all three thresholds consistently rank higher than slower competitors with similar content quality. Running a regular website speed test is no longer optional — it is a foundational SEO practice.
The good news: most speed issues are fixable. Image compression alone can reduce load time by 40–60%. Enabling a CDN can cut TTFB by over 50%. Our tool identifies exactly which fixes will have the biggest impact on your specific page.
Core Web Vitals & Speed Metrics Explained
Understanding what each metric measures helps you prioritize the right fixes. Here are all six metrics our website speed test analyzes, with Google's official thresholds:
| Metric | What It Measures | Score Thresholds | How to Improve | ||
|---|---|---|---|---|---|
| LCP | Time for the largest visible element (hero image or text block) to fully render | Good ≤ 2.5s | Moderate ≤ 4s | Poor > 4s | Compress hero images, use WebP/AVIF, preload critical resources, use CDN |
| CLS | Total unexpected layout shift score as the page loads (elements jumping around) | Good ≤ 0.1 | Moderate ≤ 0.25 | Poor > 0.25 | Set width/height on all images & videos, avoid inserting content above existing elements |
| INP | Longest delay between any user interaction (click, tap, keypress) and visual response | Good ≤ 200ms | Moderate ≤ 500ms | Poor > 500ms | Reduce heavy JavaScript, break up long tasks, use requestAnimationFrame for UI updates |
| TTFB | Time from browser request to receiving the first byte of data from your server | Good ≤ 800ms | Moderate ≤ 1.8s | Poor > 1.8s | Upgrade hosting, enable server caching, use a CDN (Cloudflare), reduce database queries |
| FCP | Time until the first piece of content (text or image) appears on screen | Good ≤ 1.8s | Moderate ≤ 3s | Poor > 3s | Eliminate render-blocking resources, inline critical CSS, minimize server response time |
| Page Load Time | Total time to fully load all page resources (HTML, CSS, JS, images) | Good ≤ 2s | Moderate ≤ 4s | Poor > 4s | Reduce total page size, minimize HTTP requests, defer non-critical resources |
Synthetic Testing vs. Real User Monitoring (RUM): Which Do You Need?
There are two ways to measure website performance. Understanding the difference helps you choose the right approach for your situation:
🔬 Synthetic Testing (Our Tool)
- Automated browser loads your page under controlled conditions
- Consistent, repeatable results — ideal for benchmarking
- Test before launching changes — catch regressions early
- No traffic required — works on staging and new sites
- Best for: diagnosing specific issues, comparing before/after
👥 Real User Monitoring (RUM)
- Collects data from actual visitors' sessions in real time
- Shows how different devices, networks, and locations experience your site
- Reveals issues only visible under real-world conditions
- Requires existing traffic to collect meaningful data
- Best for: understanding real user experience across segments
For most website owners, start with synthetic testing (like our free tool) to identify and fix issues, then layer in RUM data via Google Search Console's Core Web Vitals report for ongoing monitoring.
How to Fix Common Website Speed Issues (Ranked by Impact)
These are the highest-impact optimizations, ordered by how much load time improvement they typically deliver:
-
Compress and Serve Images in Next-Gen Formats
Images are typically 50–80% of a page's total weight. Convert to WebP or AVIF format, compress to under 100KB where possible, and always specify
widthandheightattributes to prevent CLS. Use lazy loading (loading="lazy") for images below the fold. Expected improvement: 40–60% reduction in load time. -
Enable a Content Delivery Network (CDN)
A CDN caches your static assets on servers worldwide, reducing TTFB and load time for visitors far from your origin server. Cloudflare's free plan is an excellent starting point. Expected improvement: 30–50% TTFB reduction for international visitors.
-
Implement Server-Side and Browser Caching
Caching prevents your server from regenerating the same page for every visitor. For WordPress sites, plugins like WP Super Cache or W3 Total Cache handle this. Set appropriate
Cache-Controlheaders for static assets. Expected improvement: 50–70% faster repeat visits. -
Minify and Defer Non-Critical JavaScript & CSS
Render-blocking JS and CSS delay the browser from displaying your page. Minify all code files to remove whitespace and comments. Use
deferorasyncfor non-critical scripts. Load CSS asynchronously where possible. Expected improvement: 0.5–1.5 seconds off FCP and LCP. -
Upgrade Your Hosting or Server Configuration
Shared hosting on overloaded servers is a leading cause of high TTFB. Consider upgrading to a VPS or managed hosting provider. Enable GZIP/Brotli compression on your server. Ensure your PHP version is current (8.x for WordPress). Expected improvement: 200–800ms TTFB reduction.
-
Optimize Specifically for Mobile Page Speed
Mobile devices have less processing power and often run on 4G or slower connections. Use responsive images with
srcsetto serve smaller files to smaller screens. Reduce JavaScript execution time. Avoid large CSS animations on mobile. Test your mobile score separately — it often differs significantly from desktop.
Desktop vs. Mobile Website Speed Test: Why You Need Both
Desktop and mobile speed scores are often dramatically different — sometimes by 30–50 points. This is because Google simulates mobile tests using a mid-tier Android device with a throttled 4G connection, while desktop tests assume a faster CPU and broadband connection.
Since Google switched to mobile-first indexing in 2021, your mobile Core Web Vitals score is the one that primarily determines your search ranking. A perfect desktop score with a poor mobile score will still hurt your rankings. Use the device toggle above to test both versions and prioritize improving your mobile score first.
Frequently Asked Questions About Website Speed Testing
-
A score of 90–100 is considered excellent (Fast), 50–89 needs improvement (Moderate), and below 50 is poor (Slow). Google uses Core Web Vitals thresholds: LCP under 2.5s, CLS under 0.1, and INP under 200ms for a "Good" rating. Aim for 90+ on both desktop and mobile for maximum SEO benefit.
-
TTFB (Time to First Byte) is the time from when a browser requests a page to when it receives the first byte of data from your server. A good TTFB is under 800ms. Improve it by using a CDN, upgrading your hosting plan to reduce server load, enabling server-side caching, and optimizing database queries on database-driven sites.
-
Mobile speed tests simulate a mid-tier device with a slower CPU and throttled 4G connection, while desktop assumes full processing power. Common causes of mobile-specific slowness include unresponsive images (not using srcset), heavy JavaScript that blocks the main thread, and animations that stress mobile GPUs. Use the Mobile toggle in our tool to get your mobile-specific score and recommendations.
-
LCP (Largest Contentful Paint) measures how long it takes for the largest visible element on your page — usually a hero image or a main headline — to fully render in the viewport. A good LCP score is 2.5 seconds or less. Between 2.5s and 4s needs improvement. Above 4 seconds is considered Poor by Google and will negatively impact your search ranking.
-
CLS (Cumulative Layout Shift) measures how much your page layout shifts unexpectedly while loading — for example, buttons that move when an image loads above them. A score of 0.1 or less is good. To fix high CLS: always set explicit width and height attributes on all images and video elements, reserve space for ads with min-height, and avoid inserting dynamic content above existing page content after load.
-
INP (Interaction to Next Paint) replaced FID (First Input Delay) as a Core Web Vital in March 2024. It measures the longest delay between any user interaction — a click, tap, or keypress — and the browser's next visual response. A good INP is under 200ms. High INP is usually caused by heavy JavaScript that blocks the browser's main thread. Reduce long tasks, defer non-critical JS, and avoid synchronous operations triggered by user events.
-
Yes. Google has used page speed as a ranking signal for desktop since 2010 and for mobile since 2018. Core Web Vitals (LCP, INP, CLS) became official ranking signals as part of the Page Experience Update in 2021. Pages that pass all three Core Web Vitals thresholds are eligible for a ranking boost over slower competitor pages with otherwise similar content quality.
-
Synthetic testing uses automated browsers in controlled, repeatable conditions — perfect for diagnosing specific issues and comparing before/after changes. Our free tool uses synthetic testing. Real User Monitoring (RUM) collects performance data from actual visitors' sessions, showing how real-world factors like device type, geographic location, and network speed affect your site. Google's CrUX data in Search Console is a free source of RUM data.
-
Run a speed test after every significant change to your site: installing or updating a plugin, adding a new page section, embedding third-party scripts (chat widgets, ad networks), or uploading new images. Additionally, run a baseline test at least once a month. Third-party scripts are a particularly common hidden cause of performance regressions — test before and after adding any external script.
-
The most common causes in order of frequency: (1) Oversized, uncompressed images in PNG or JPEG format instead of WebP. (2) Render-blocking JavaScript and CSS that delay the browser from rendering the page. (3) No browser or server-side caching configured. (4) Slow server response time (high TTFB) from shared hosting overload. (5) Too many HTTP requests from loading too many separate files. (6) Missing CDN, resulting in high latency for non-local visitors. (7) Unoptimized third-party scripts like chat widgets, ad platforms, and social media embeds.
More Free SEO Tools to Optimize Your Website
Website speed is one piece of the SEO puzzle. Use these free tools alongside your speed test to cover every aspect of on-page and technical SEO:
Website Speed Test: Check & Optimize Your Site’s Performance
A website speed test tells you exactly how fast your web page loads for real users — and why it matters. Slow load times hurt your Google rankings, drive visitors away, and kill conversions. Tools like GTmetrix, Pingdom, and Google PageSpeed Insights make it easy to run a free website speed test and get a full breakdown of your site’s performance in seconds.
When you run a test, you’ll see key metrics like TTFB (Time to First Byte), DNS lookup time, HTTP/2 connection status, and total page load time. These numbers reveal whether your server is slow, your images are unoptimized, or your JavaScript and CSS are blocking the page from rendering quickly.
For WordPress users, common culprits include oversized PNG and JPEG images, missing caching, and no CDN. Using Cloudflare as a CDN reduces latency by serving your content from servers closer to your visitors — whether they’re in San Francisco, Singapore, or Mumbai.
Testing from multiple locations is equally important. A site hosted on a USA server may load fast locally but feel sluggish for non-US visitors due to geographic distance from the data centre.
The goal? Get your page speed score out of the average 74–85 range and into genuinely fast territory — because in 2026, speed is not optional.