
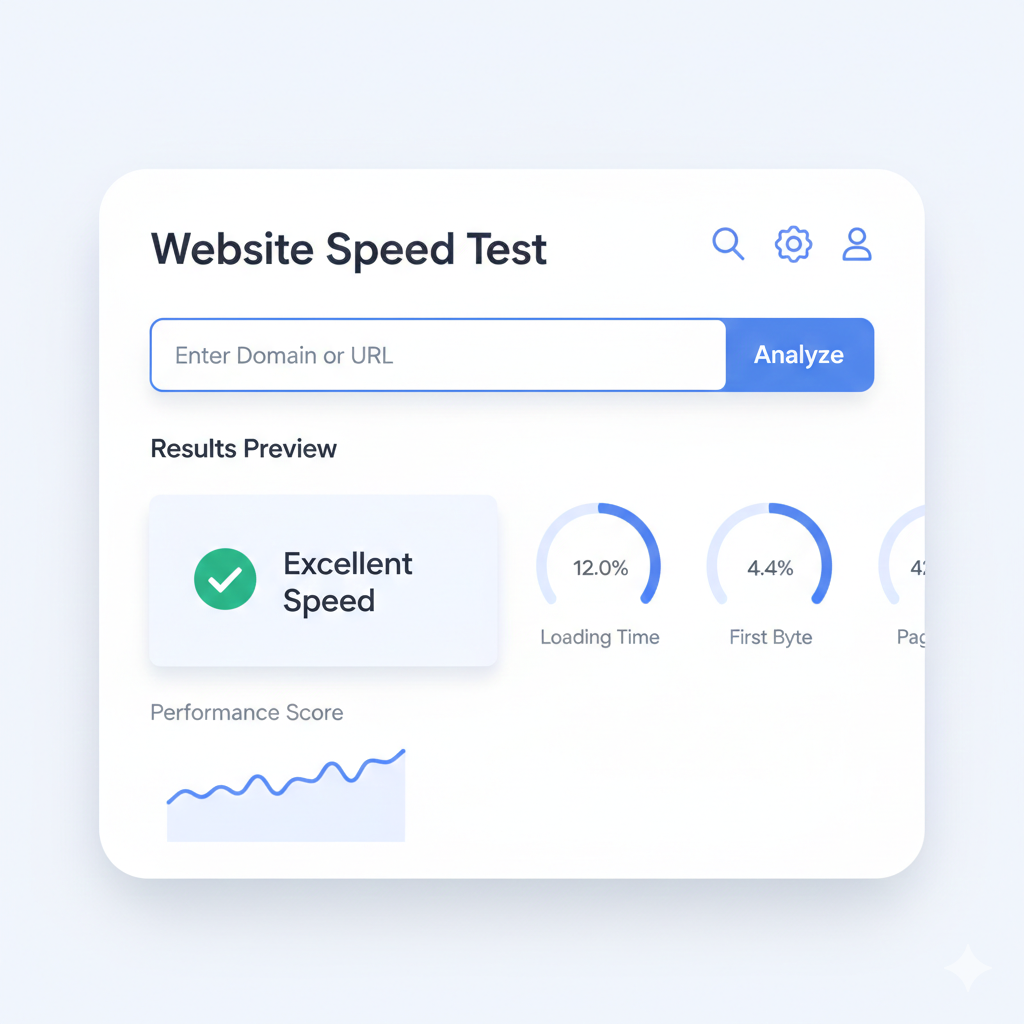
A website speed test measures how fast your web page loads for real users across different locations. Whether you’re running a WordPress site or an eCommerce store, your load time directly impacts user experience, SEO rankings, and conversions. Slow sites lose visitors — fast sites win
Why Website Speed Testing Matters for US Audiences
Most American users expect a site to load in under three seconds. If it doesn’t, they bounce. Google has made it clear that page load time is a ranking factor, and tools like Google Analytics and Google PageSpeed Insights (also known as PageSpeed Insights or simply the “google website speed test”) give site owners actionable data to fix performance issues before they cost real traffic.
Beyond SEO, speed affects revenue. Studies consistently show that every additional second of load time reduces conversions — especially on mobile. Running regular optimization tests is not optional for competitive websites in 2025.
Best Free Website Speed Test Tools
GTmetrix Speed Test
GTmetrix is one of the most popular tools for a free website speed test. It provides a detailed breakdown of your page — including requests, file sizes, JavaScript execution, CSS rendering, and first byte timing. GTmetrix’s page speed score typically falls in the 74–85 range for average sites before optimization.
GTmetrix also allows you to choose your test location, including options like San Francisco, Singapore, and the Mumbai region — making it valuable for understanding how non-European visitors and users outside the USA experience your site.
Pingdom Website Speed Test
Pingdom is widely trusted for monitoring web page performance from multiple locations. Its results include:
- TTFB (Time to First Byte) — how quickly the server responds
- DNS lookup time
- HTTP/2 connection status
- Load time by content type (HTML, CSS, JavaScript, PNG, JPEG)
Pingdom’s free plan gives you access to test locations including Seattle and others in the USA. It’s especially useful for spotting yellow bar warnings that indicate slow server response or render-blocking resources.
Google PageSpeed Insights
Google’s own tool — commonly searched as “google website speed test” — analyzes both mobile and desktop performance. It uses real-user performance data (Core Web Vitals) alongside lab results. For WordPress website speed test purposes, PageSpeed Insights is often the first stop because Google directly uses these signals for ranking.
Website Speed Test for Mobile
Mobile testing deserves its own focus. Google indexes mobile-first, so a slow mobile experience is a ranking killer. Tools like GTmetrix and PageSpeed Insights both offer mobile website speed test modes. Pay attention to image formats — serving WebP instead of PNGs or JPEG files can shave seconds off mobile load times.
Understanding Your Speed Test Results?
What Is TTFB and Why It Matters
TTFB, or Time to First Byte, measures how long the browser waits before it starts receiving data from the server. A high TTFB usually points to a slow server, poor server location relative to users, or lack of a CDN.
For example, if your data centre is in Seattle but most of your visitors come from Singapore or Mumbai, your latency will be high without a CDN routing traffic intelligently. Cloudflare is one of the most widely used CDN solutions that reduces latency by caching content at edge servers closer to users.
First View vs. Second Page Load
Speed test tools typically show both first view and second page load results. The first view reflects what a new visitor experiences — no browser cache. The second page load is much faster because the browser caches assets like CSS, JavaScript, and images locally.
Setting proper cache headers — such as ExpiresbyType in Apache — tells the browser how long to cache specific file types. A week cache for static assets is a common best practice.
Bandwidth Utilization and Request Count
High bandwidth utilization and too many HTTP requests are two of the biggest performance killers. Each image, CSS file, JavaScript file, and HTML document adds to the total request count. Reducing requests through techniques like CSS sprites, lazy-loading, and combining files significantly improves load time.
Website Speed Test: Multiple Locations
Testing from a single location gives an incomplete picture. A site hosted on a USA server may perform well for visitors in San Francisco but deliver poor results in Singapore or Mumbai due to geographic distance.
Running a website speed test from multiple locations helps identify:
- Where your actual users experience the slowest performance
- Whether your CDN is functioning correctly
- Regional latency issues tied to server location or data centre proximity
Tools like Pingdom and GTmetrix both support multi-location testing, making it easy to compare average page load times across regions.
WordPress Website Speed Test and Optimization
WordPress powers over 40% of the web, making WordPress-specific speed optimization critical. Common issues flagged during a WordPress website speed test include:
- Unoptimized PNG images and JPEG files
- Render-blocking JavaScript and CSS
- No caching plugin configured
- Missing CDN integration (Cloudflare is the most popular free option)
- Slow webserver response due to shared hosting
Quick wins for WordPress performance:
- Enable caching via plugins like W3 Total Cache or WP Rocket
- Compress and convert PNG images to WebP
- Enable HTTP/2 connection support on your host
- Use a CDN to serve static content from edge locations
- Implement lazy-loading for images below the fold
Advanced Optimization Techniques

Caching and Dynamic Content
Caching is the foundation of web performance. Static assets — HTML, CSS, JavaScript, PNG images — should be cached aggressively. Dynamic content like user dashboards or cart pages requires more nuance since it changes per session.
For server-level caching, a shell script or command-line configuration can automate cache-clearing after content updates, which is especially useful for high-traffic sites running NopCommerce or Discourse forums.
CDN Strategy
A CDN like Cloudflare distributes your content across a global network. When a user in Singapore visits your site, instead of hitting your origin server in Seattle, they receive content from a nearby Cloudflare node. This dramatically reduces latency and improves TTFB.
Cloudflare’s free plan supports basic caching, DDoS protection, and HTTP/2 — making it a solid choice even for small sites.
Image Optimization
Images are typically the heaviest assets on any web page. Best practices include:
- Use modern image formats (WebP over JPEG or PNG)
- Compress PNGs without quality loss
- Implement lazy-loading so images below the fold only load when needed
- Use descriptive file names for SEO purposes
Real-User Performance and Reporting
Lab data from tools like Pingdom and GTmetrix is valuable, but real-user performance reporting tells the complete story. Platforms like Google Analytics track how actual users experience your site, while tools like SOASTA (now part of Akamai) provided more advanced real-user monitoring — historically referenced alongside solutions like mPulse for web performance measurement.
The difference between test results and what actual users experience often comes down to device type, IE8 browser compatibility (for legacy audiences), connection speed, and geographic location. Always cross-reference lab test results with field data.
FAQ: People Also Ask
1. What is the best free website speed test tool? GTmetrix and Google PageSpeed Insights are the most popular free tools. Both provide detailed performance breakdowns, including load time, TTFB, and optimization recommendations.
2. How do I do a website speed test from multiple locations? Tools like Pingdom and GTmetrix allow you to select test locations such as San Francisco, Singapore, or Seattle, helping you understand performance for visitors in different regions.
3. Why is my website slow even though my speed test looks good? Lab test results may not reflect real-user performance. Factors like actual user device type, connection speed, and geographic distance from your server can affect the experience significantly.
4. How does a CDN improve website speed? A CDN like Cloudflare caches your content on servers worldwide, reducing latency by serving files from a location closer to each visitor instead of routing all traffic to a single origin server.
5. How often should I run a website speed test? Running a speed test at least once a week — or after any major site update — is considered best practice. Regular testing helps catch regressions before they impact real users.
Conclusion
A website speed test is not a one-time task — it’s an ongoing part of responsible site management. Whether you use GTmetrix, Pingdom, or the Google website speed test tool, the goal is the same: reduce load time, improve TTFB, and deliver a fast experience to every visitor regardless of their location.
For WordPress sites especially, combining a CDN, smart caching, image optimization, and clean HTML structure can move your page speed score from the 74–85 range into truly fast territory. Start testing today, and let the data guide your optimization strategy.